.png)
How to Make Yourself More Valuable in MSK Care
- Greg Dea

- Oct 5, 2025
- 6 min read
Updated: Mar 26

What if you could make yourself more valuable tomorrow —to your clinic, your referrers, your sports club, your insurer, and your patients?
Not by adding another technique……but by mastering a system that proves value where others can’t.
And here’s the kicker —it’s not taught in university. Not even in most post-grad programs.

The Truth Nobody Teaches You
Most clinicians fix the local problem. Few can prove they’ve changed the system.
A shoulder, a back, a knee — pain gone, case closed. Until it comes back. Or shows up somewhere else.
You fixed the symptom. But you didn’t touch the global risk factors —movement quality, stress, recovery, sleep, load, resilience.
That’s the difference between being useful and being valuable. Between providing care… and creating change.
Why It Matters to Everyone Who Pays the Bills
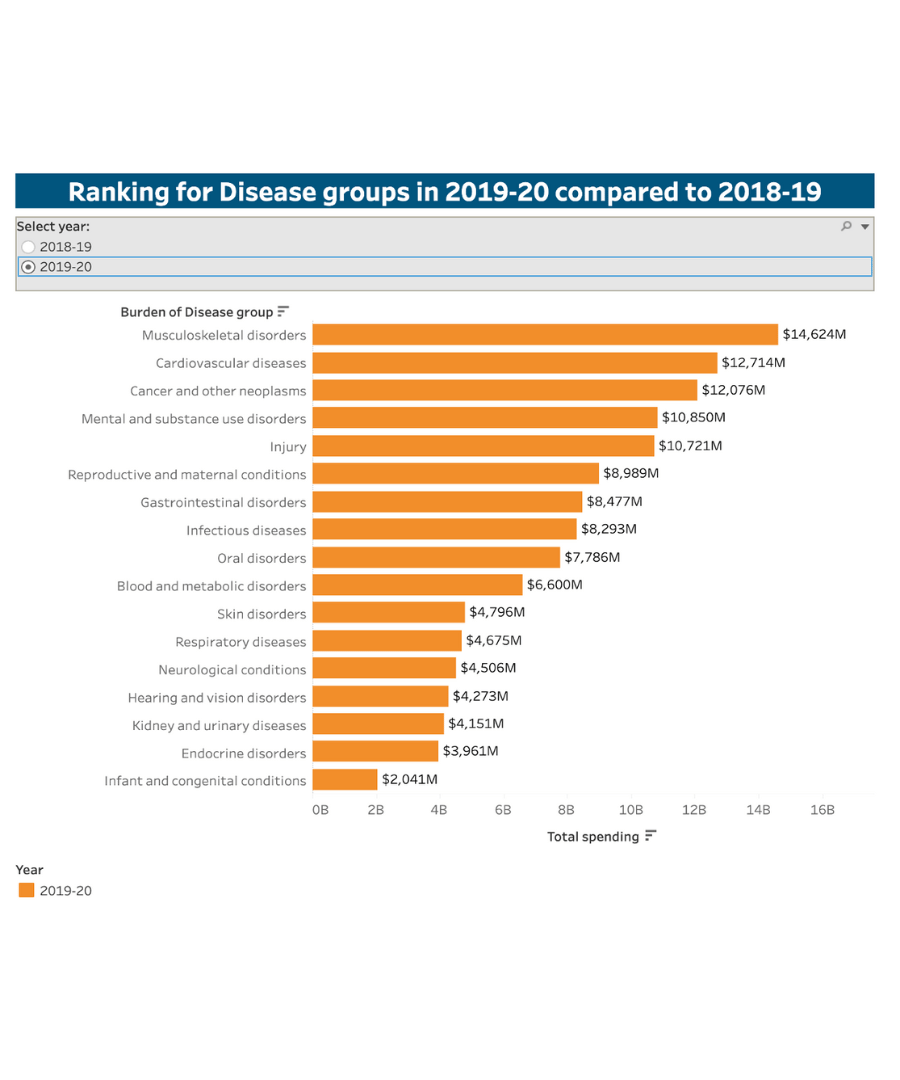
MSK conditions are the #1 cause of chronic disability worldwide. And in Australia, the story is even sharper.
GPs see more musculoskeletal and injury-related cases than any other health category. Together, they account for around 900 Medicare item codes — more than heart disease, cancer, or mental health — making them the most frequently managed problems in primary care.

Every recurrence, every strain, every “niggle” has a price tag — not just to the patient, but to employers, insurers, and clubs.
Poor movement = higher cost. Good movement = fewer claims, fewer setbacks, fewer dollars burnt.

Movement Has a Dollar Value
In the U.S., OSHA tracks what common workplace injuries actually cost.
Injury Type | Direct Cost | Indirect Cost | Total |
Sprains | $30,487 | $33,535 | $64,022 |
Strains | $32,023 | $35,225 | $67,248 |
Inflammation | $39,122 | $43,034 | $82,156 |
That’s not hospital data — that’s everyday movement-related injury data.
At a 6% profit margin, a business needs over $1.1 million in extra sales to cover a single sprain or strain. At 3%, that number skyrockets past $2.2 million.
One preventable injury can erase a year’s profit.
That’s the hidden economy of poor movement. And it’s where clinicians can prove their worth — by reducing preventable cost through measurable improvement.

Firefighters, Warfighters, and the Cost of Moving Outside the Bandwidth
When movement falls outside an acceptable performance bandwidth, safety drops and cost explodes.
In U.S. firefighter academies, recruits scoring ≤ 13 on the Functional Movement Screen accounted for 80% of total sprain/strain injury costs (USD $826,900), even though they represented just 30% of the group (Butler et al., Work, 2013).

In U.S. military training, soldiers with lower movement scores were twice as likely to be injured or fail to graduate, due to both injury and non-injury reasons (Raleigh et al., 2010).
Yet the mindset persists —
“Movement variation is natural. We just need to get stronger.” But the evidence is clear: moving poorly reduces safety, performance, and profit.

Sport: When Injury Equals Losing
Some organisations don’t track injury cost — they track performance.
Across 11 years of UEFA Champions League data, teams with fewer injuries finished higher in league tables and won more trophies (Hägglund et al., Br J Sports Med, 2013).
Ekstrand put it simply:
“Teams with fewer injuries have better results in UEFA tournaments and national leagues.”
The same holds for tactical athletes. When movement stays inside the bandwidth, retention, readiness, and team performance rise. When it falls outside, attrition, cost, and risk skyrocket.

Runners: Speed and Pain History
Even among recreational athletes, the pattern repeats. Runners with a history of lower extremity injury or low back pain — even when asymptomatic — performed slower on the 20 m shuttle run than matched controls (Nadler et al., Arch Phys Med Rehabil, 2002).
Movement outside a functional bandwidth doesn’t just predict injury — it limits speed, power, and performance, long after pain is gone.

From Injury to Inactivity: The Domino Effect
Here’s the hard truth. When movement stops, everything else starts to go wrong.
“Physical inactivity is an actual contributing cause to at least 35 unhealthy conditions.” — Kohl et al., 2012 “It shortens healthspan and accelerates disease.” — Booth et al., 2017
MSK injuries are the spark. Physical inactivity is the fire.
Unless movement is restored — quality movement — the spiral continues.
Proof: Data from the U.S. Army
Teyhen et al. (2020) tracked 922 soldiers and found a clear pattern:
the more risk factors a person carries, the greater their likelihood of injury and time loss.
Their model identified 11 measurable variables — including prior injury, dorsiflexion asymmetry, pain with movement, and Y-Balance deficits — that predicted injury with striking accuracy.
Here’s the key takeaway:
Of the 16+ known risk factors for future injury, 10+ are movement-related dysfunctions.

That’s our domain — the part of the system we can see, assess, and change.
It’s also the part that drives everything else.
Those same 10+ dysfunctions are tightly linked to stress, recovery, sleep, load, and resilience.
When they spiral, so does everything around the injured person: their family, their workplace, their team.
And the monetary costs? Extraordinary — but, crucially, manageable.
When clinicians can identify and correct these dysfunctions early, they don’t just reduce injury risk.
They protect livelihoods, relationships, and resources. That’s what real value looks like in MSK care.
What University Didn’t Teach You
No degree shows you how to map those risk factors, measure change, and prove outcomes that make insurers, clubs, and employers pay attention.
That’s why so many good clinicians plateau. They master techniques — but never learn the system.
The SFMA: Turning Movement into a Metric
The Selective Functional Movement Assessment (SFMA) does exactly that. It connects local pain to global dysfunction and turns movement quality into a quantifiable outcome measure.
Every box you uncheck in the SFMA Top Tier = one less risk factor = one step closer to measurable value.
And when you can track that improvement, you can show:
Fewer recurrences for patients
Higher KPIs for clinic owners
Fewer claims for insurers
More games played for clubs
More credibility for you
That’s not theory — that’s effectiveness.

Proof in Practice
Across two state-league Australian football clubs, in two different states, over six seasons,
clinicians using this system achieved key performance indicators that matched or exceeded AFL benchmarks —with less time and fewer resources.
That’s what happens when you apply a system that sees beyond local tissue and treats the whole risk profile.
The Clinician Who Measures What Matters Wins
Pain relief is expected. Durability is respected. Measurable risk reduction?
That’s valuable.That’s effective.
➡️ Learn how to apply the SFMA system practically — and translate movement into measurable value.
References
Workplace & Cost Data
Occupational Safety and Health Administration (OSHA). (n.d.). Safety Pays: Estimator. Retrieved October 2025 from https://www.osha.gov/safetypays/estimator
Global Burden & Physical Inactivity
Booth, F. W., Roberts, C. K., Thyfault, J. P., Ruegsegger, G. N., & Toedebusch, R. G. (2017). Role of inactivity in chronic diseases: Evolutionary insight and pathophysiological mechanisms. Physiological Reviews, 97(4), 1351-1402. https://doi.org/10.1152/physrev.00019.2016
Kohl, H. W. III, et al. (2012). The pandemic of physical inactivity: Global action for public health. The Lancet, 380(9838), 294-305.
Australian Context
Australian Institute of Health and Welfare (AIHW). (2020). Disease expenditure in Australia 2018-19.https://www.aihw.gov.au/reports/health-welfare-expenditure/disease-expenditure-australia-2018-19
Risk Factors & Movement Bandwidth
Teyhen, D. S., Shaffer, S. W., Butler, R. J., Goffar, S. L., Kiesel, K. B., & Plisky, P. J. (2020). Identification of risk factors prospectively associated with musculoskeletal injury in a warrior athlete population. Sports Health, 12(6), 528-536.
Butler, R. J., Contreras, M., Burton, L. C., Plisky, P. J., Goode, A., & Kiesel, K. (2013). Modifiable risk factors predict injuries in firefighters during training academies. Work, 46(1), 11-17.
Raleigh, M. F., McFadden, D. P., Deuster, P. A., Davis, J., Knapik, J. J., Pappas, C. G., & O’Connor, F. G. (2010). Functional movement screening: A novel tool for injury risk stratification of warfighters. Military Medicine, 175(6), 471-477.
Nadler, S. F., Moley, P., Malanga, G. A., Rubbani, M., Prybicien, M. J., & Feinberg, J. H. (2002). Functional deficits in athletes with a history of low back pain: A pilot study. Archives of Physical Medicine and Rehabilitation, 83(12), 1753-1758.
Nadler, S. F., Malanga, G. A., Feinberg, J. H., Rubanni, M., Poley, P., & Foye, P. (2002). Functional performance deficits in athletes with previous lower-extremity injury. Clinical Journal of Sport Medicine, 12(2), 73-78.
Elite Sport & Injury-Performance Link
Hägglund, M., Waldén, M., Magnusson, H., Kristenson, K., Bengtsson, H., & Ekstrand, J. (2013). Injuries affect team performance negatively in professional football: An 11-year follow-up of the UEFA Champions League injury study. British Journal of Sports Medicine, 47(12), 738-742.
Ekstrand, J. (2013). Keeping your top players on the pitch: The key to football medicine at a professional level. British Journal of Sports Medicine, 47(12), 723-724.


Comments